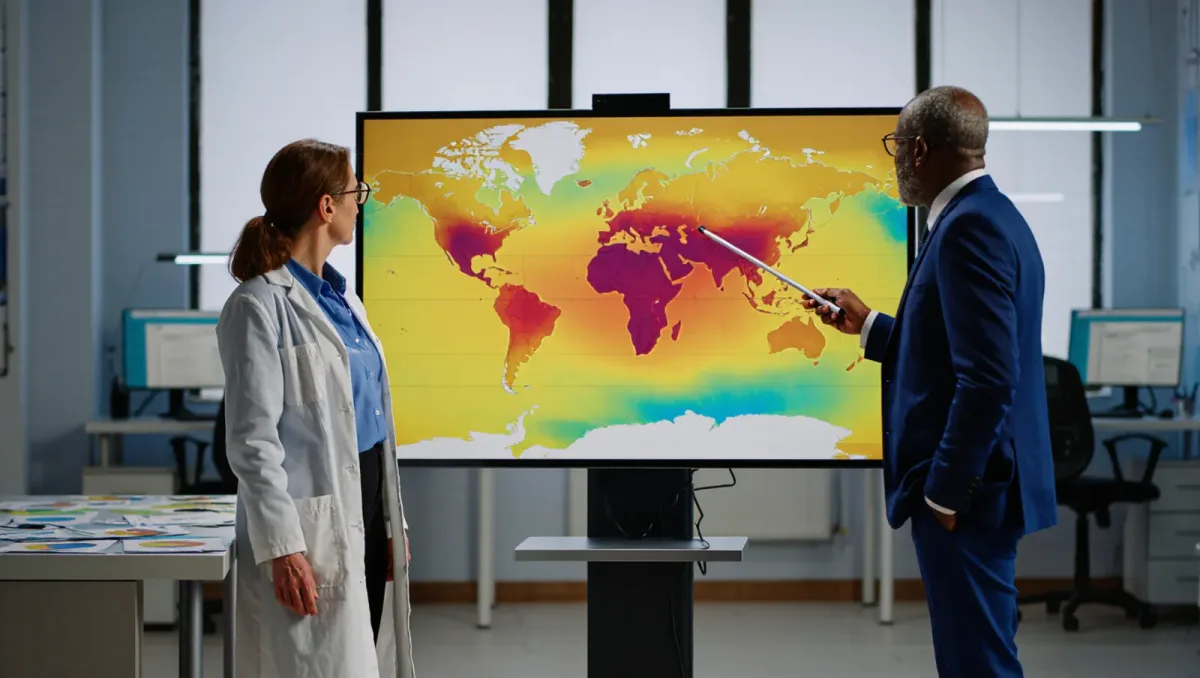
Global surface temperatures in 2025 made it the third-hottest year in records stretching back to 1850, per the Copernicus Climate Change Service, which published its annual assessment on January 13, 2026. The service, operated by the European Centre for Medium-Range Weather Forecasts, also reported that 2025 was the warmest year on record for Antarctica — a region that had until recently lagged the global warming trend. Only 2024 and 2023, the two El Niño-boosted years, were hotter globally.
Temperature records are public-health and infrastructure data, not health advice; regional planning questions deserve local expertise.
How warm was it, and how do we know?
Copernicus combines millions of measurements from weather stations, ships, buoys, and satellites into its ERA5 reanalysis, then cross-checks the global mean against independent datasets from NASA, NOAA, Japan's Meteorological Agency, and the UK Met Office. The 2025 global mean landed roughly 1.5 degrees Celsius above the pre-industrial baseline used in the Paris Agreement — close to, but the service cautioned not proof of breaching, the agreement's long-term limit, which refers to a sustained multi-decade average rather than a single year.
Why does Antarctica's record matter separately?
The southern continent has warmed unevenly: East Antarctica stayed comparatively stable while the Antarctic Peninsula and West Antarctica warmed fast. A continent-wide record year matters because Antarctic ice loss drives a growing share of sea-level rise, and because warm years stress sea ice that already collapsed to record-low extents in 2023 and 2024. The January 13 release noted that the 2025 melt season added to evidence that the region's variability is shifting toward the warm side of model expectations.
What was behind 2025's warmth?
Greenhouse gases were the backdrop — Copernicus reported atmospheric carbon dioxide above 425 parts per million during the year, a record. But the year's ranking also reflects the absence of cooling: the 2024-2026 La Niña conditions in the tropical Pacific, which normally suppress global temperatures slightly, did less than usual to offset the long-term trend. Natural variability sets the ordering among recent years; the trend line underneath it is the forcing.
What would confirm or revise the ranking?
The final word comes from the independent centers' year-end datasets, published in the following weeks; the NASA and NOAA analyses, due mid-January, occasionally shift a ranking by one place because they treat the data-sparse Arctic differently. The Antarctic finding is more strong than the global ordinal — continent-scale warmth showed in multiple independent reanalyses. The number to track next is whether 2026, forecast to begin under La Niña, finally breaks the recent string of top-three finishes.