A study enrolling 100,000 people can find that a supplement shifts average weight by 0.3 kilograms over a year — and report it as a statistically significant effect, because with enough participants even a whisker of a difference becomes too consistent to blame on chance. Significance answered one question: is the observed pattern distinguishable from random noise? Effect size answers the one readers actually care about: how big is the difference, and does it change anything? The two can come apart in both directions — trivial effects can be significant, and genuinely important effects in small studies can fail to reach significance — which is why methodologists have spent decades arguing that the p-value without its effect size is half a report — a point a 2019 commentary in Nature by Valentin Amrhein, Sander Greenland and Blakeley McShane pressed on the entire field, collecting hundreds of co-signatories in the process.
This is an explainer on reading research; it is not guidance about any treatment or intervention.
How is effect size actually measured?
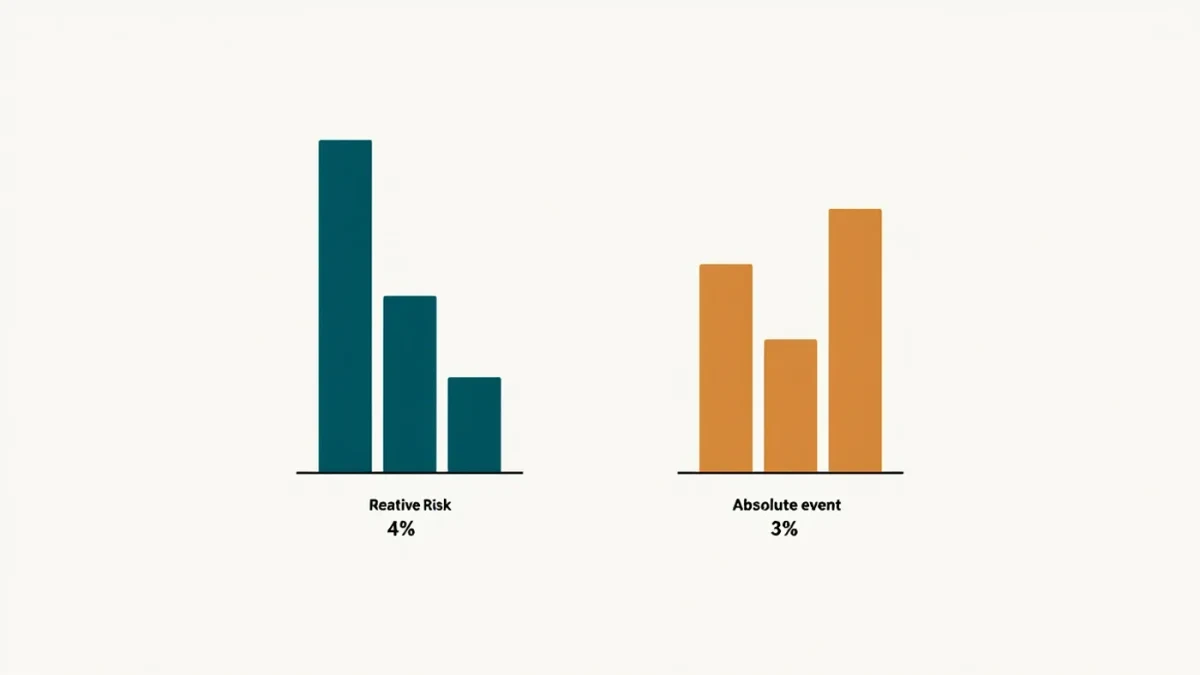
Different designs use different currencies. Comparisons of two means are often standardized as Cohen's d — the difference divided by the pooled standard deviation, so 0.2 reads as small, 0.5 moderate and 0.8 large by the conventions Cohen himself flagged as rough. Correlations report as r, with 0.1, 0.3 and 0.5 as customary small-to-large markers. Medical research prefers absolute risk differences: a drug that halves risk sounds dramatic, but the difference between 2 in 10,000 and 1 in 10,000 is one event — the absolute effect that matters to a patient. Relative effects flatter; absolute effects inform, and the same study can sound revolutionary or modest depending on which the abstract leads with.
Where did the conventions come from?
Jacob Cohen, whose 1988 power tables standardized the small-medium-large vocabulary, spent his later career insisting the labels were temporary scaffolding — rules of thumb for behavioral research, not physics constants. Meta-analysts now report effects in heterogeneous metrics: standardized means, odds ratios, correlations, hazard ratios per unit of exposure. Comparing effects across studies requires converting between these currencies, and the conversions carry assumptions. The practical upshot for a reader is modest: treat any 'small/medium/large' label as a starting hypothesis, and look for the effect expressed in units you can picture — points on a test, events per thousand people, minutes of sleep — before deciding what the finding is worth.
Why does sample size make significance cheap?
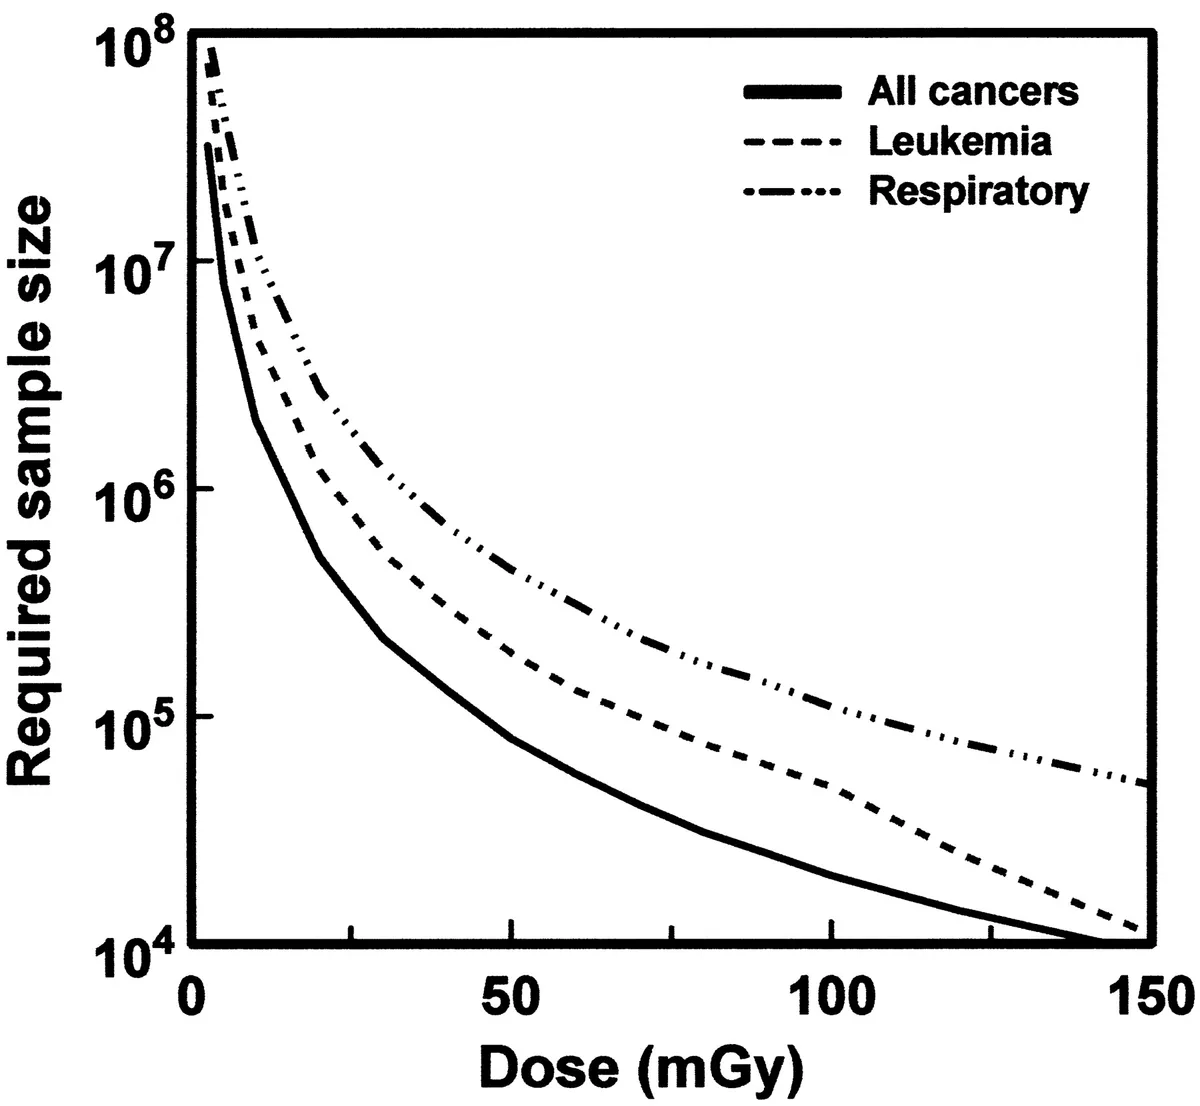
The p-value is a function of effect size and precision together. As samples grow, standard errors shrink, so a fixed, tiny true difference eventually produces tiny p-values — significance becomes a statement about the sample size as much as about the world. In very large datasets, including administrative records covering millions of people, nearly every measured difference registers as significant, and discriminating findings by p <0.05 becomes meaningless. The reverse failure happens in small studies: a large, real effect observed with high variance can miss significance entirely, which is how important early findings get dismissed and later rediscovered with adequate samples.
How strong is the evidence that fields overweight significance?
This is unusually well-documented. The American Statistical Association's 2016 statement explicitly warned that p-values do not measure the importance of a result. Analyses of published literature across psychology and medicine have found that most papers report significance verdicts while a minority report effect sizes or confidence intervals; audits after journal-policy changes show reporting improves when required. And the replication projects of the 2010s demonstrated the practical cost: many replicated effects were real but far smaller than the original papers implied, meaning the significance held while the headline effect size did not. Converging, replicated meta-science — not a single study.
What are the benchmarks worth knowing?
For individual decisions, useful comparisons include: the standardized effect of routine educational interventions, many of which fall below d=0.4; annual flu vaccination's absolute risk reduction, typically a few percentage points depending on the season and population; and the effect of aspirin-like interventions measured in events prevented per thousand treated. Benchmarks discipline intuitions in both directions — they deflate panics over tiny effects and prevent dismissal of small effects that apply to entire populations, where a d of 0.1 shifted across millions of people can move real aggregates. Context, not the number alone, decides whether an effect matters.
What is the 'significance fallacy' in headlines?
The pattern repeats across coverage: a large registry study finds a 'significant link' between a food and an outcome, and the coverage omits that the absolute difference is a fraction of a percent over decades. The link is real in the sense that it exceeds noise; its practical content may be nearly nil. The mirror image matters too — null results reported as 'no effect' when the confidence interval spans both nothing and something substantial. In both cases, the interval — the range of effect sizes compatible with the data — carries the information the binary verdict destroyed. Readers trained to look for the interval, or at least the raw estimate in its plain units, will find that most research stories become calmer and more informative at the same time.
How should a reader use this?
Read results sections for the estimate and its interval before the verdict. A confidence interval from 0.05 to 0.15 in a correlation study says: small, precisely bounded, real, probably minor. The same interval spanning zero to 0.5 says: could be nothing, could be large, unknown — a very different paper wearing the same 'not significant' label. Reporters and abstracts that lead with relative risks or significance words while burying absolute effects are doing the reader's thinking; the effect size, in its plainest units, is the finding.
What would fix the imbalance?
Journals that require effect sizes and intervals by policy, estimation-focused teaching in methods courses, and readers who ask 'how much?' before 'was it significant?' The endgame the reform movement describes is familiar by now: significance is a screening step, effect size is the result, and only publications that report both let a reader decide what — if anything — changed.