A p-value of 0.03 does not mean a result has a 97 percent chance of being true. It does not mean the finding is important, or that it will replicate. What it means is narrower: if there were truly no effect in the population being studied, a result at least this extreme would appear by chance about 3 percent of the time. That single conditional statement — the p-value is the probability of the data given a null hypothesis, never the probability of the hypothesis given the data — is where most misinterpretation begins, and the American Statistical Association devoted an entire 2016 statement to correcting it after decades of misuse accumulated across fields.
This article is an explainer on research methods, not statistical advice for any specific analysis; readers working with data should consult a qualified statistician.
Where do the misreadings come from?
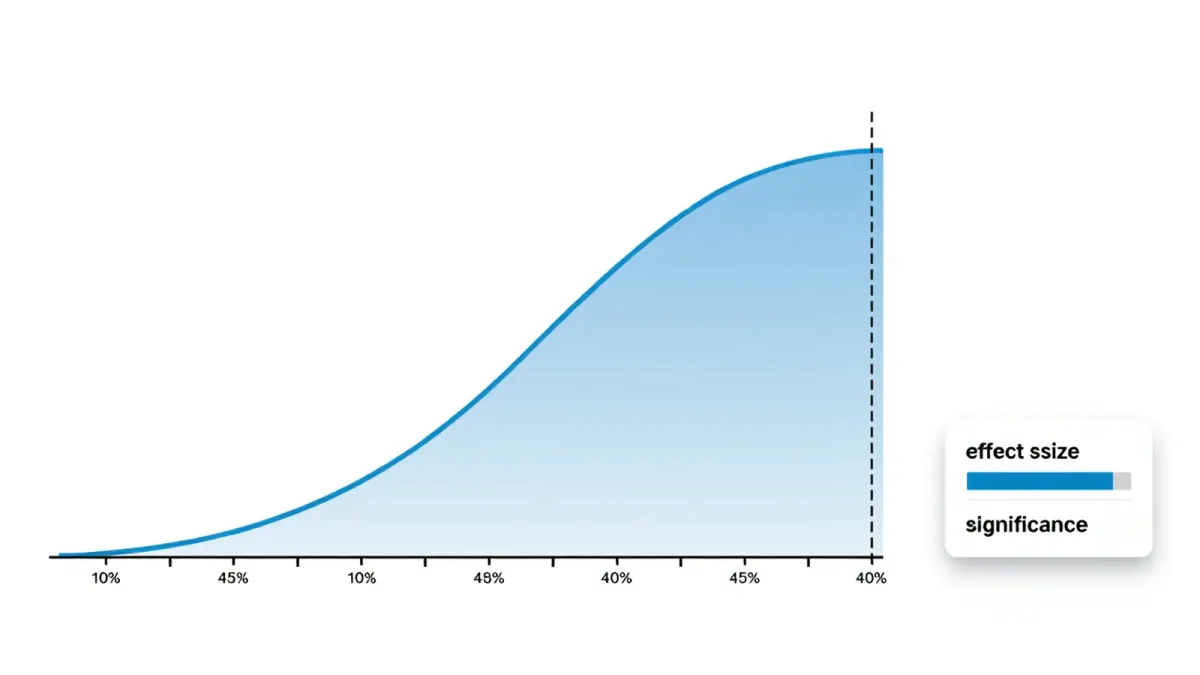
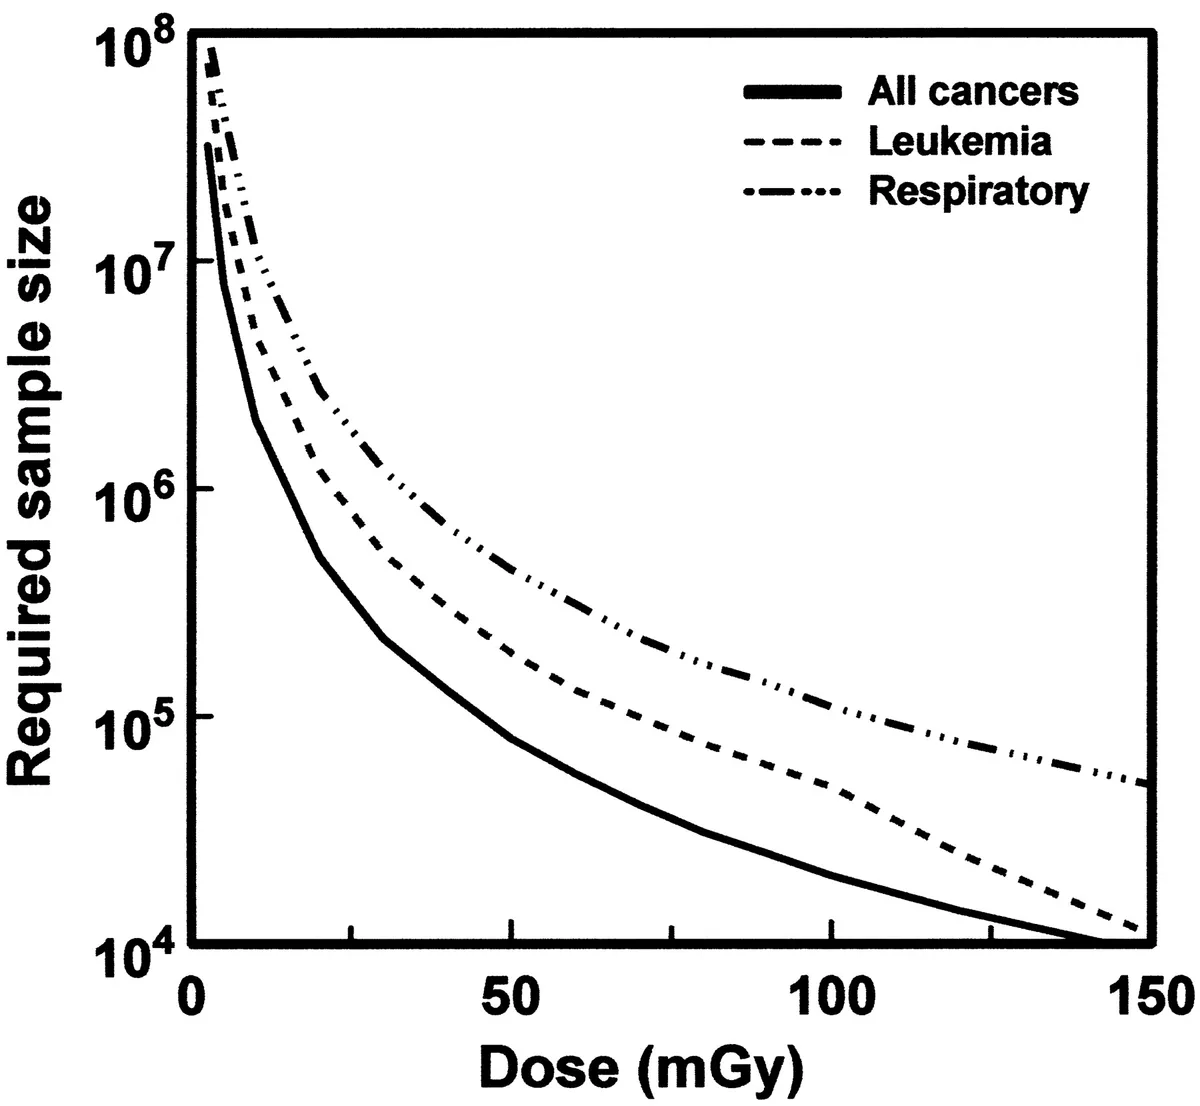
Several false translations circulate widely, and cognitive scientists have documented them even among working researchers trained in statistics. The inversion error — reading 'the data are unlikely under the null' as 'the null is unlikely given the data' — is the most common, and the two statements can differ enormously in practice because the base rate of true hypotheses in a field matters. A second error is the 'proof' reading, where crossing 0.05 ends the conversation instead of opening it. A third is confusing statistical significance with practical importance: with a large enough sample, a trivially small difference between groups produces a tiny p-value, and without the effect size sitting next to it the number invites an inflated headline. Each misreading survives because the binary language of 'significant versus not' rewards it, which is why reform proposals target the vocabulary as much as the threshold itself.
Why did p <0.05 become the border between 'real' and 'not real'?
The 0.05 threshold is a convention, not a law of nature. It traces to early twentieth-century work by R.A. Fisher, who suggested one-in-twenty odds as a rough flag worth a second look, not as a verdict. Journals and reviewers gradually hardened the convention into a gate: cross below 0.05 and a finding becomes 'statistically significant' and publishable; land at 0.06 and the same data may be filed away. The asymmetry has documented consequences. Researchers can reach a 'significant' result by collecting data until the p-value dips, by slicing outcomes into subgroups, or by choosing between similar analytic methods after seeing the results — practices researchers call p-hacking, and which simulation studies show can turn pure noise into 'discoveries' a striking share of the time.
What can a p-value actually establish?
A small p-value does three honest things. It says the observed data would be unusual under a specific null model. It provides a continuous measure of incompatibility — a p of 0.001 is a stronger signal of incompatibility than 0.04, which is why many statisticians recommend reporting exact values rather than the binary 'significant/not significant.' And, in combination with the study design, it helps rule out boring explanations like sampling flukes. What it cannot do, on its own, is establish that a hypothesis is true, estimate how large an effect is, or say anything about whether the study was well designed in the first place. A biased study produces confident p-values that point nowhere.
How strong is the evidence hierarchy here?
The case against threshold worship rests on replicated methodological work, not a single study. In 2016 the American Statistical Association's statement — reviewed and endorsed by its board and developed through months of public comment — laid out six principles, including that p-values do not measure the size of an effect or the importance of a result. In 2018, a 72-author group led by Daniel Benjamin of the University of Southern California proposed in a comment published by Nature Human Behaviour that researchers in some fields adopt 0.005 as the threshold for 'statistical significance,' reserving 0.005–0.05 as 'suggestive' — a proposal grounded in calculations about how threshold choices affect false-positive rates. The peer-reviewed statistical literature on p-hacking, from simulation studies by Simmons, Nelson and Simonsohn onward, has been extended and debated across many journals. That is a converging body of work, though the exact remedies remain contested: no consensus statement has replaced 0.05 field-wide.
Does this mean p-values are useless?
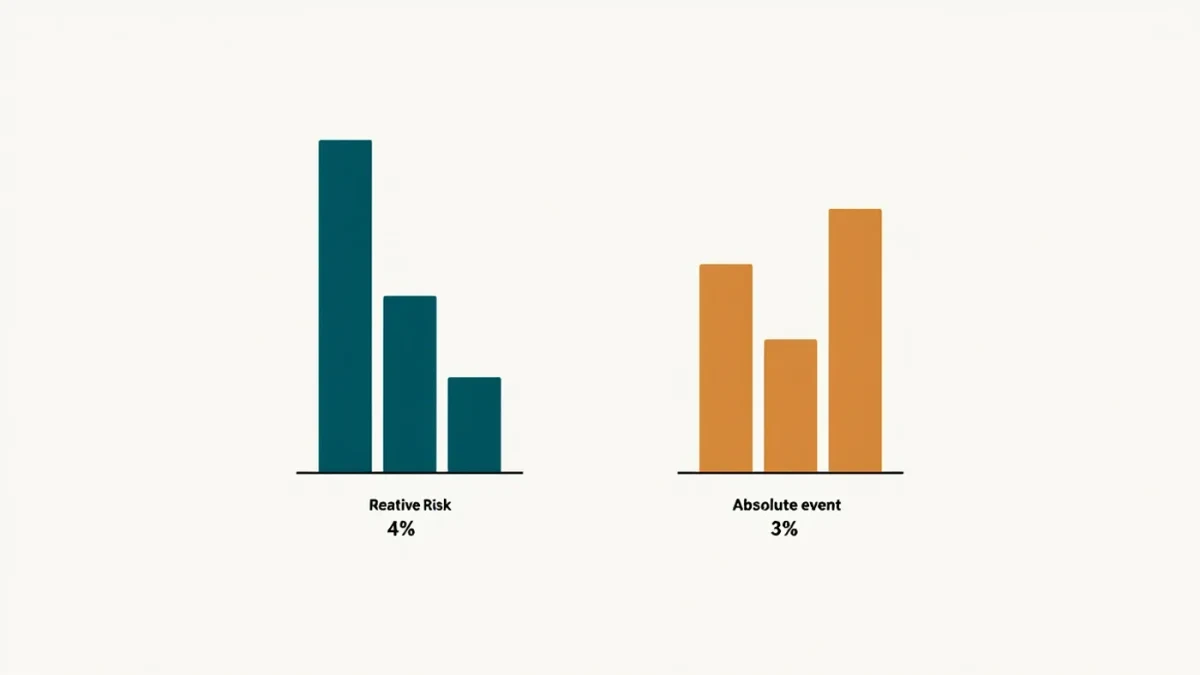
No — the failure mode is treating a continuous measure of evidence as a binary verdict. Statisticians generally recommend a bundle: report exact p-values alongside effect sizes and confidence intervals, which show how big an effect is and how precisely it is measured; prefer pre-specified analyses over post hoc ones; and weigh any single result against prior evidence. Bayesian methods, which assign probabilities to hypotheses directly, are a widely discussed complement, though they bring their own assumptions. Some journals have gone as far as banning significance language; most have not.
How should a reader judge a headline finding?
Three questions do most of the work. First, what is the p-value exactly — and is the effect large enough to matter in the real world? A weight-loss drug can produce a 'significant' 0.2-kilogram advantage. Second, was the analysis decided in advance, or does the paper read like the researchers tried several routes and reported the one that worked? Third, has anything similar replicated — because one p-value, however small, is a single experiment's worth of evidence. Read that way, the p-value returns to its proper job: one clue among several, in a dossier that also includes design, effect size, and whether independent teams find the same thing.
What would change the picture?
Fields that adopt stricter thresholds, larger samples, and mandatory reporting of all measured outcomes would shrink the false-positive problem measurably. The ongoing test is whether replication rates in psychology, biomedicine and social science improve in large preregistered efforts. If they do, the lesson stands: the number was never the verdict — the accumulation of independent evidence is.