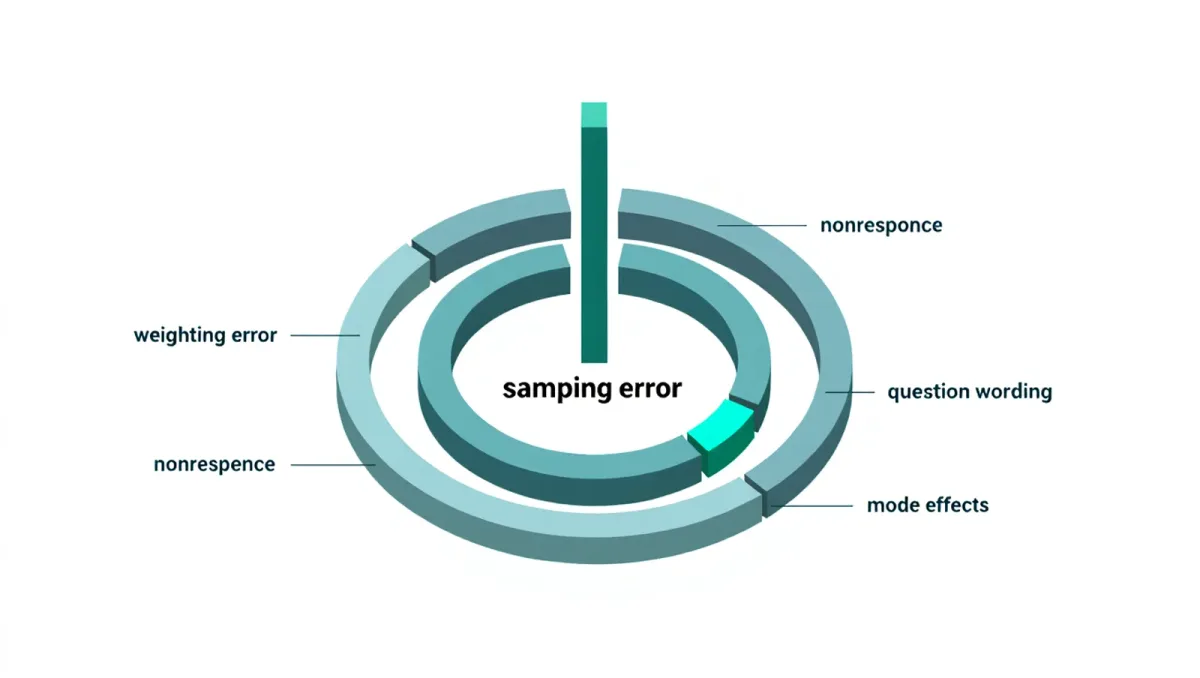
When a poll of about 1,000 randomly selected adults reports a candidate at 51 percent with a margin of error of plus or minus 3 points, the number describes one narrow thing: how much the result would wobble if the survey were repeated many times with fresh random samples of the same design. At a 95 percent confidence level, that wobble for n=1,000 is about plus or minus 3 points — the arithmetic follows a simple square-root law, because error shrinks with the square root of the sample size. What the number does not cover is every other way a survey can be off: the sample may not resemble the population, people may not answer honestly, and the questions themselves may steer the answers. In modern survey research, those covered-by-nothing errors are usually bigger than the headline margin.
This is a methods explainer; it analyzes survey techniques, not electoral predictions or betting guidance.
What is the square-root law, and why does it disappoint?
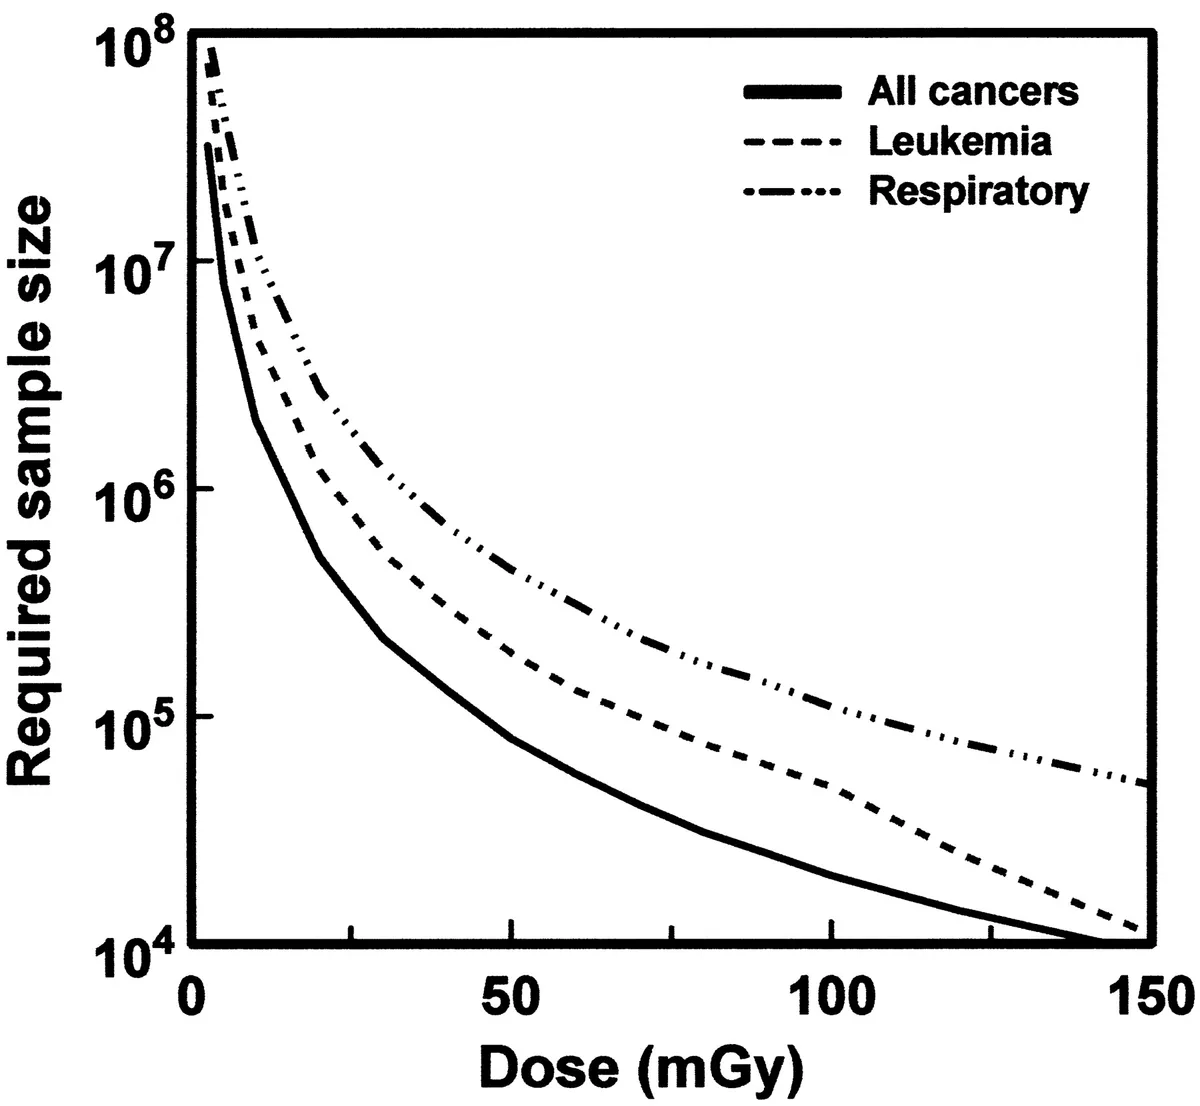
Sampling error falls with the square root of n: to halve the margin of error you must quadruple the sample. Going from 1,000 respondents to 4,000 moves a +/-3.1-point margin to about +/-1.5; reaching +/-0.5 would require roughly 100,000 respondents, which is why extreme precision is bought only by pooling or weighting model-based estimates rather than brute-force sampling. The arithmetic also explains diminishing returns in practice — the difference between 800 and 1,200 respondents is meaningful, the difference between 5,000 and 6,000 is barely visible — so budget conversations about 'more respondents' often buy nothing that matters while the unmeasured errors stay exactly where they were.
What does weighting fix — and what can it break?
No random sample lands with the exact demographics of the population, so researchers weight respondents — giving, say, a 22-year-old without a degree the weight of several respondents to match census benchmarks on age, education, race and region. Weighting is essential and unstable. If a demographic group is both underrepresented and politically or behaviorally distinctive, the result depends heavily on the weights, and small sample cells produce big swings. The 2016 US election exposed the mechanics: a report by the American Association for Public Opinion Research after the election found that state-level polls overstated Clinton's strength, with analysis pointing to education-weighting failures — college graduates were overrepresented among respondents in several key states — and to a late shift among undecided voters that pre-election snapshots missed.
Why has nonresponse changed everything?
The margin-of-error formula assumes probability sampling: everyone in the population has a known, nonzero chance of selection. Response rates to telephone surveys fell into the single digits by the mid-2010s, per Pew Research Center's tracking, which means the formula's assumption holds shakily even for well-run polls. A 6 percent response rate is not a random 6 percent — it is whoever answers unknown numbers. The industry's responses include online panels recruited to be representative, weighting on ever-finer benchmarks, and statistical post-stratification. Each helps; none restores the clean mathematics, which is why serious survey organizations now report design effects and weighting detail rather than a bare +/- figure.
How big are the errors the margin ignores?
Methodological studies that compare polls with eventual election results give a calibrated answer. AAPOR's post-2016 analysis found state polls' average error was roughly twice their historical norm. Meanwhile, question wording experiments — where the same population is asked slightly different versions of a question — routinely shift responses by several points, more than a typical margin of error. Order effects, social desirability (people underreport attitudes they think are disapproved), and mode differences (phone versus online versus in person) all contribute documented, reproducible distortions of comparable size. This is one of the best-replicated bodies of knowledge in social science, because every election and census offers a fresh validation set.: predictions are made before the outcome is known, and the outcome grades them. Few fields get that kind of recurring, unforgiving audit, and the cumulative lesson of decades of such audits is that the printed plus-or-minus figure is the smallest honest number in the report.
How should a reader treat a survey number?
First, ask who was sampled and how — probability panel, opt-in online, phone. Second, look for weighting disclosure: a poll that won't say what it weighted on deserves suspicion. Third, treat the margin of error as a floor, not a ceiling: a 3-point lead within 3 points is a tie even before other errors. Fourth, prefer trends in many surveys over any single one; averaging reduces idiosyncratic errors even if it cannot remove shared ones. And for claims about behavior rather than votes — health habits, spending — remember social desirability pushes estimates in predictable directions, so triangulation against administrative data is the gold standard.
What would make surveys trustworthy again?
The field's own agenda points the way: transparent methodology reporting, probability-based panels, better incentive structures to lift response rates, and validation studies that compare survey answers to records. The pressures are not unique to election polling — federal statistical agencies, including NSF's National Center for Science and Engineering Statistics, face the same falling response rates in measuring the scientific workforce. The signal to watch is calibration — how far aggregated polls land from known outcomes. On current evidence, surveys remain far better than chance and far noisier than their margins imply, and readers who understand both halves will out-read the headlines every time a new number lands.