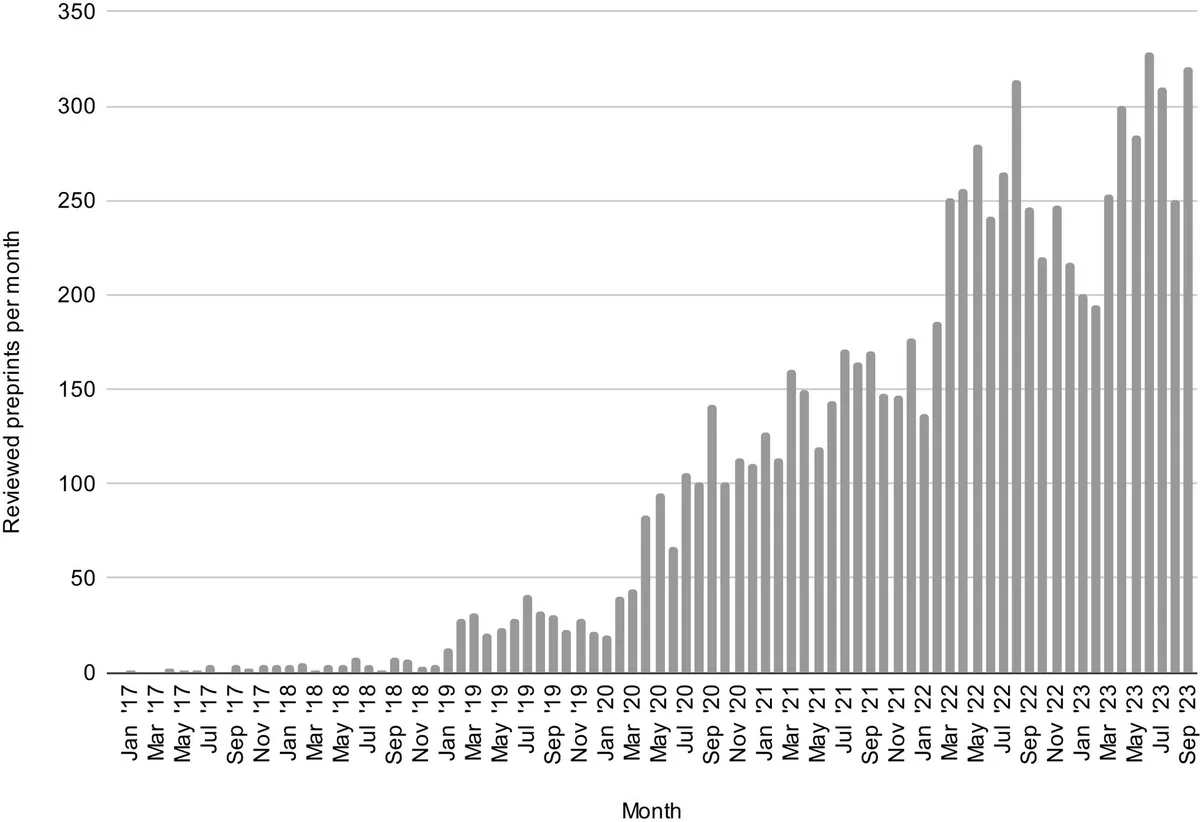
Citation graph tools now map a field from a few seed papers. Research Rabbit leads much of that shift. A 2023 review by librarians Victoria Cole and Mish Boutet documented how it works. It ran in the Journal of the Canadian Health Libraries Association. The main limit is openness: the company shares little about its ranking engine.
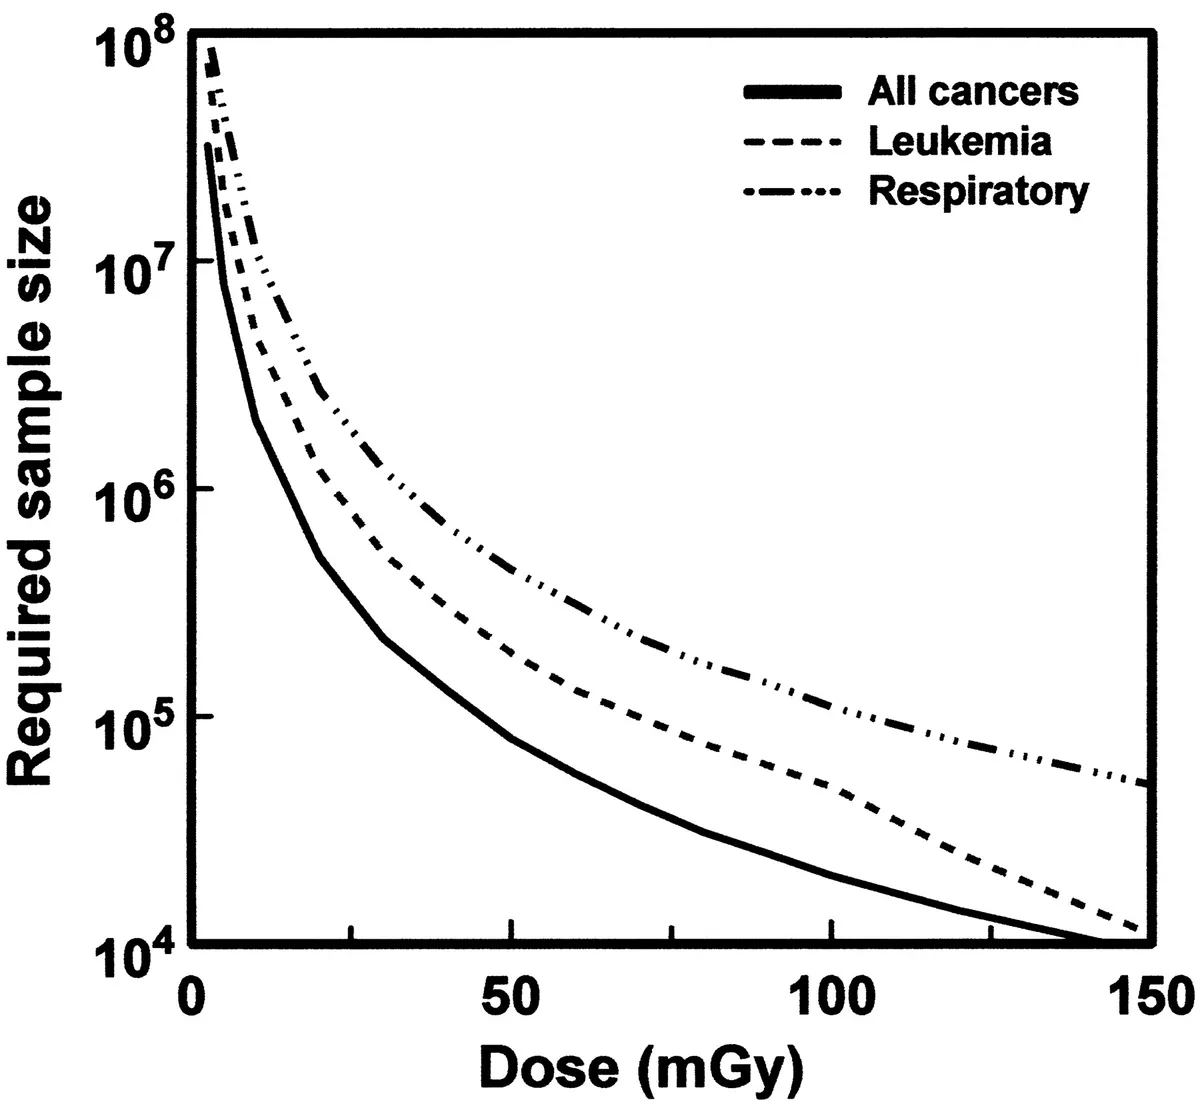
Discovery is one step, and judging evidence is another. Once a map surfaces candidate papers, the counting behind each finding still matters, as this walkthrough of sample size in small studies shows. A graph can point at a paper, yet only the paper itself shows how strong its data are.
This guide explains how the tools build their maps, what the library review found, and where the documented limits sit. More coverage of research methods lives in the research section. Every claim here draws on a library product review and a university comparison, not on vendor pages.
How Do Citation Graph Tools Build Their Maps?
They rank papers by citation links rather than by keywords alone. The library at the Hong Kong University of Science and Technology keeps a running comparison of these tools. It states that Connected Papers arranges papers by co-citation and bibliographic coupling. Research Rabbit instead grows a set of seed papers and returns related items through shared citations.
The data behind both tools come largely from Semantic Scholar, per the same comparison. A 2020 preprint on arXiv showed another route. A team at the Allen Institute for Artificial Intelligence built the SPECTER method. It trains paper embeddings on the citation graph, so citation context becomes the signal of relatedness.
- Connected Papers starts from one seed paper and draws a map of related work.
- Research Rabbit grows a whole collection and suggests similar, earlier, and later work.
- Both draw on the Semantic Scholar dataset, according to the library comparison.
What Did the Library Review Find in Research Rabbit?
The review found a workflow built on collections. A user adds publications, and the system then suggests papers in three modes: similar work, earlier work, and later work. Author views add papers from related researchers. The results appear as network or timeline maps.
Cole and Boutet published this product review in the Journal of the Canadian Health Libraries Association in 2023. Search inside the tool runs on PubMed and Semantic Scholar, and uploads accept RIS or BibTeX files. Cost is documented too: all features were free when the review ran, and the company insists that will not change for researchers. The same table caps free Connected Papers users at two maps a month, five with an account.
Where Do These Tools Fall Short?
The engine is thin on record. Cole and Boutet report that the Research Rabbit team says little about its ranking logic, citing citation networks plus what the company calls some additional magic. Output therefore resists audit. The review sees the tool as an add-on to structured database searches, not a swap for them.
Mechanism adds a second limit. Co-citation and coupling need existing citations, so a brand-new paper barely registers until others cite it. The review also flags cluttered author networks. One person can appear as two nodes with different counts, so every map needs a human check.
Conclusion: A Strong Compass, Not a Full Map
Citation graph tools compress weeks of reference chasing into hours. The evidence about them comes from a named product review and a university library comparison. That evidence is descriptive, not a controlled accuracy test. The vendors publish no accuracy claims for anyone to verify.
The safer routine pairs the map with the ground truth. Use a graph tool to find candidates, then read the methods section of each paper. Keep a structured database search in the loop for coverage. The map is a compass; the papers remain the terrain. This connects to our earlier piece, Underpowered Studies Find Too Much, and Too Big.